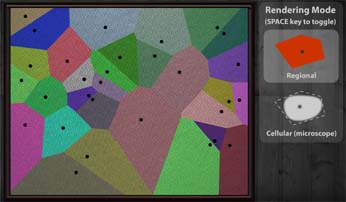
What This Is
A Voronoi Diagram is a set of regions calculated around a given set of seed points, wherein any point within a region is closer to that region's seed than to any other seed. If that doesn't make sense, imagine a set of cell phone towers (seed points) plotted on a map. A voronoi would be useful in determining the exact coverage area of each tower. A person standing at any location on the map would fall into one of the defined regions, which would immediately determine the cell tower they're closest to.
Why Do I Care
I've been exploring ways to dynamically fracture shapes into smaller chunks that could be chipped away or exploded as part
of a 2D physics game I'd like to make (eventually). The amount of processing it takes to create an effect is a huge concern
in computer graphics, so most attempts to simulate real-world phenomena are largely approximated to save on computation time.
Every white paper I found on fracturing used mathematically accurate engineering models to determine the characteristics of
various rock types, which, besides being incomprehensible were totally impractical for my needs.
I stumbled upon voronoi diagrams while searching for intersecting line formulas on Wikipedia. They looked nearly identical
to the sketches I'd made in previous attempts to solve the problem, so it was a perfect application.
The shapes appeared chunky and rock-like, and because voronoi cells are convex by nature, the new chunks would play well
with most most 2D physics engines.
There are two ways to calculate voronois that I found. One was easy but incredibly slow; the other was surprisingly fast but far more complicated. You can learn about the methods here, at the American Mathematical Society.
I owe an enormous thanks to Alan Shaw for his AS3 port of Steve Fortune's original sweep line algorithm for quickly calculating voronois.
Relax Mode
The relaxation is accomplished using Lloyd's Algorithm. Over several iterations (in this case every frame) the center point, or centroid, of each polygon is calculated using the formulas at the left (click view source to see my implementation in AS3). They first find the signed area of the polygon, which is then used to calculate the X and Y coordinates of the centroid. Using interpolation, the seeds are slowly moved a percentage towards their respective centroid until they are practically on top of one another. In a group of adjacent regions, this eventually leads to a uniform layout.
Cellular Rendering
The cellular rendering was achieved by inserting half points (in the example at left, C0 - C4) between the coordinates that make up each polygon (N0 - N4), then drawing arcs between the half points. The N points were then used as bézier control handles to keep the arc inside of the voronoi region. While in cellular rendering mode, I implemented a filter to only morph certain sets of seeds. The filter changes randomly over time to make the cells appear more organic and alive.


